The Explosion of 1944: Bergen's changing cityscape in maps.
Anyone living in Bergen is no stranger to the city’s skyline. We are fortunate to have so many mountains to climb up and view the city from, at least when its not covered in rain clouds. However, there is much more the cityscape can tell us about Bergen’s history than just the recent weather. As a GIS and mapping enthusiast, I dug deeper into one particular disaster in Bergen’s history, the explosion of 1944.
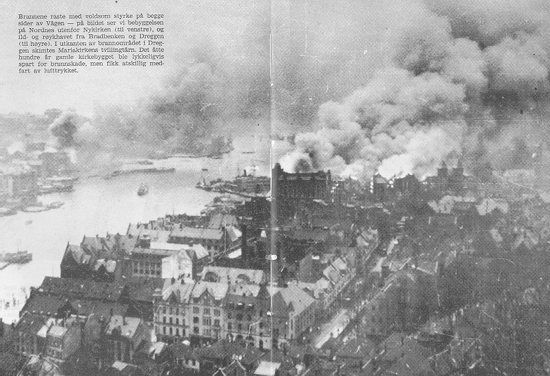
Photograph of the fires caused by the explosion of 1944 in Bergen Harbour. Image taken from Internet Archive.
Towards the final years of Nazi occupation in Bergen, a Dutch vessel, the Voorbode, was carrying a large volume of dynamite and docked in Bergen harbour despite safety regulations that should prevent ships with such cargo docking so close to a city. In the early hours of the 20th April, the ship caught fire and ignited the dynamite onboard causing a large explosion. The resulting crashing waves and fires caused destruction over a kilometre in diameter around the Festning and Nordnes areas, with a part of the anchor shooting off and landing on the side of a mountain 3km away. You can read more about it here: https://www.bergenbyarkiv.no/bergenbyleksikon/arkiv/1424148?s=Eksplosjonskatastrofen
Using historical maps and aerial orthophotos, we can see the scale of the destruction and how it has shaped the city since.
This orthophoto from 1951 clearly shows the extent of the damage:
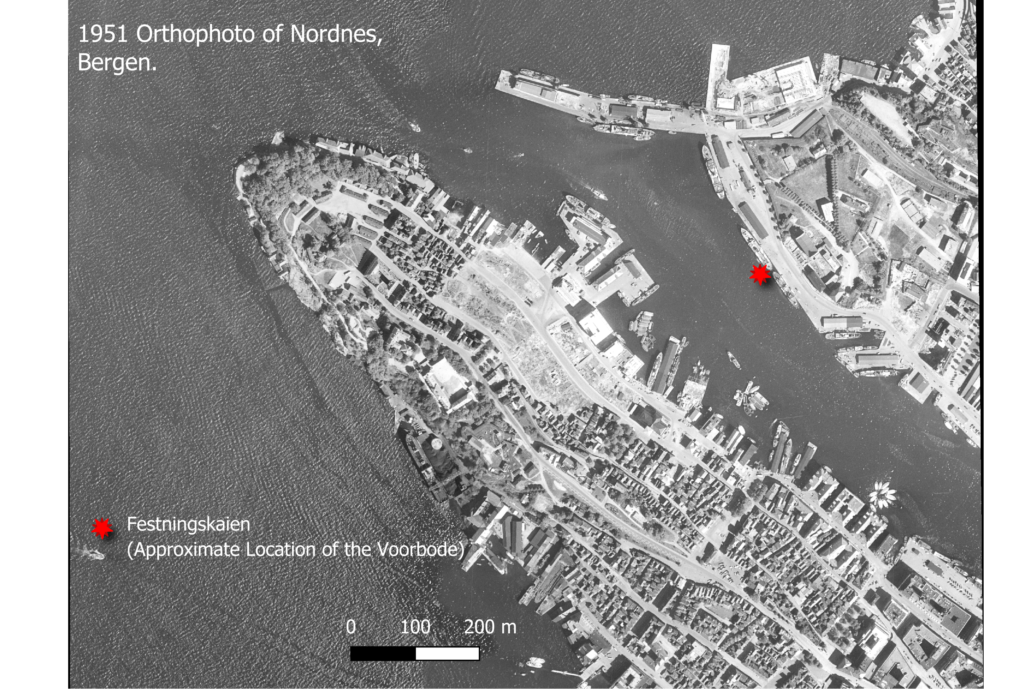
Orthophoto of Bergen in 1951, taken from Bergen Kommune.
The construction area in the centre of Nordnes is roughly 50,000 m² with additional damage to the over 700-year old Håkonshallen on the opposite side of the water along with other important historical buildings such as Bryggen and the Rosenkrantz Tower.
The next orthophoto in 1962 shows the area has been completely rebuilt, but anyone walking in this area today will immediately notice the stark change in architecture. This can be observed in the orthophoto below, showing the larger concrete blocks where the construction site used to be. This architecture is a departure from the traditional, smaller wooden housing surrounding it.
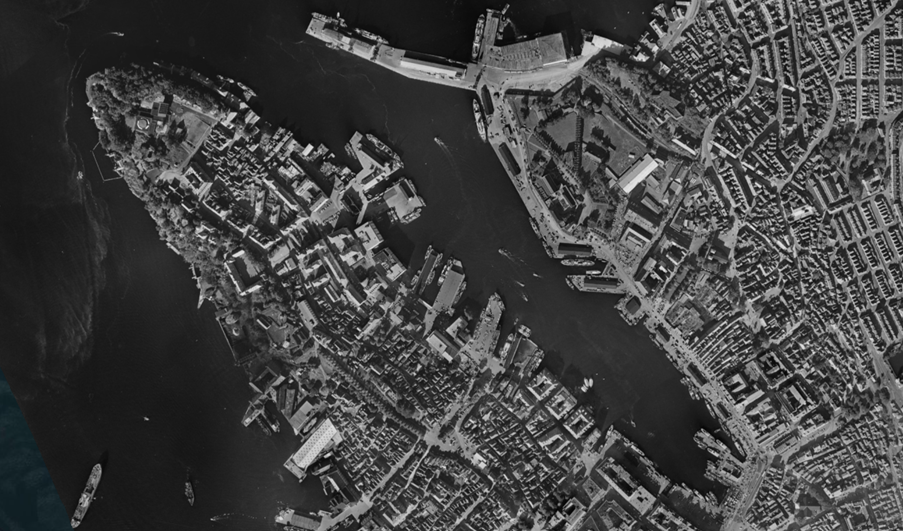
1962 Orthophoto from Norge i Bilder.
Fortunately, the hilly terrain of Bergen prevented the explosion from destroying a lot more of the Nordnes peninsula, as can be seen when comparing the 1951 image to the terrain data:
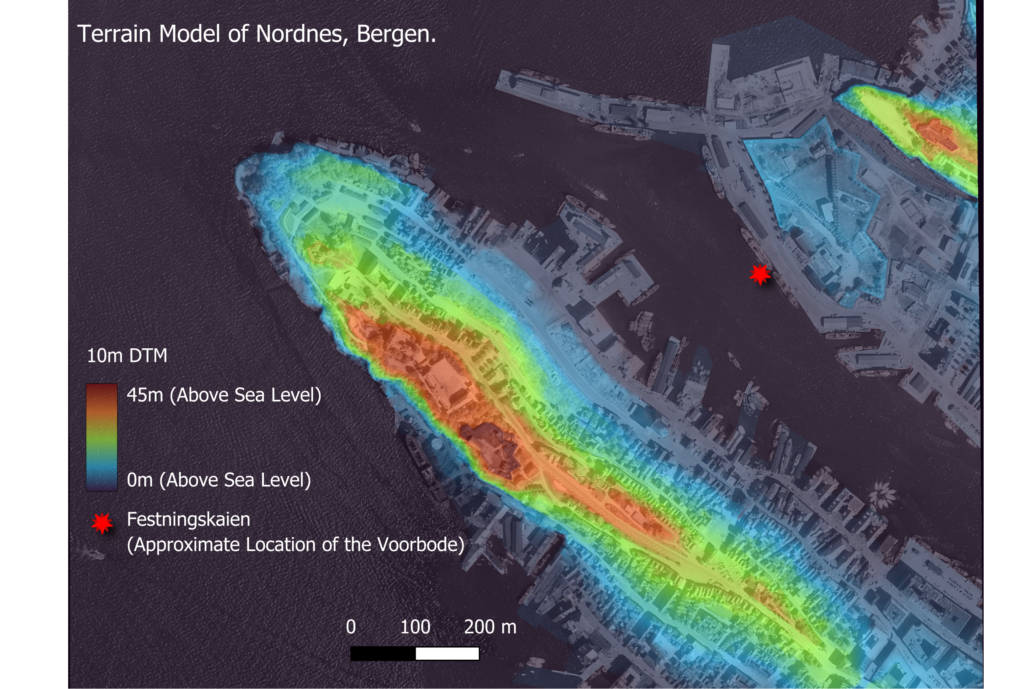
Terrain data overlaid onto the 1951 orthophoto. DTM data from Høydedata.
The area of destruction is located in the lower portions of the peninsula, close to the explosion, whereas areas at the top of the hill and behind the hill retain the traditional Bergen architecture.
By observing these maps through time, we can see the evolving nature of the city’s landscape and how events of the past shape it. The explosion of 1944 was over 80 years ago and many people living in Bergen will not be aware of its impact on the people at the time, but it’s impossible not to observe the change this disaster has caused in the landscape today. Thankfully, decades of recorded, archived and accessible mapping data allow us to visualise the impact in a clearer light.
Data Sources
Bergen Kommune:
kart.bergen.kommune.no/portal/apps/webappviewer/index.html?id=6a2f21465d86402ca3fc326eaf884f8a
Internet Archive:
https://web.archive.org/web/20110811094653/http://web.hist.uib.no/delfag-h97/tormod/explo.htm
Norge i Bilder:
https://www.norgeibilder.no/?id=3723
Høydedata:
https://hoydedata.no/
0 Comments